
Data & Reporting
DIGICoCo creates structured, visual, business-ready data and reporting systems that help organisations make better decisions, reduce errors, and streamline workflows. From Excel visualisation to tender management and interactive forms — we turn complex information into clear, usable business tools.
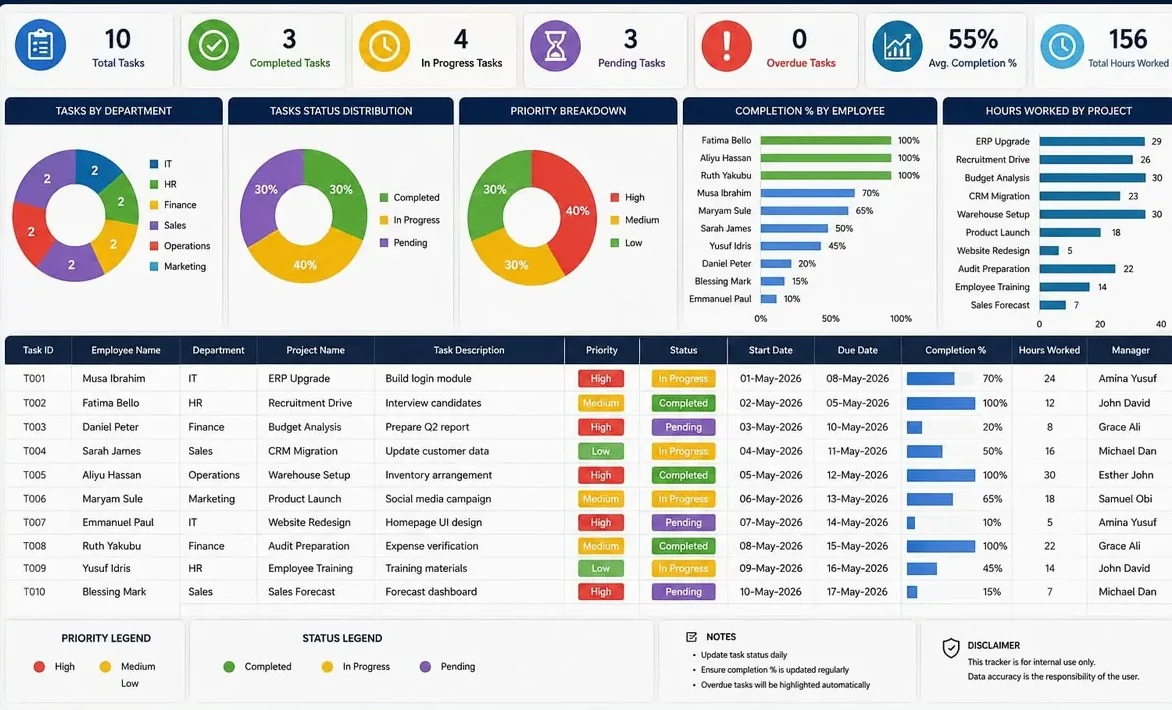
We design data and reporting solutions that include: Excel data visualisation, Tender management systems, Interactive forms & PDFs, Business reporting structures, Governance-ready templates
Global & remote delivery
Tailored project scoping
Turnaround flexibility
Sector-agnostic design
Secure online multi-currency payments
Cross-border operational flexibility
What Is Data & Reporting?
Data & Reporting refers to structured, visual, and automated systems that help organisations:
DIGICoCo transforms raw data into clear, actionable intelligence.
Problems We Solve
Most organisations struggle with:
Messy spreadsheets
Inconsistent reporting
No visual clarity
Manual tender processes
Hard-to-use forms
No governance or version control
Data captured incorrectly
Who This Is For
Corporates
Data visualisation, reporting structures, Excel engineering, governance and deployment
SMEs
Data visualisation, reporting structures, Excel engineering, tender workflow systems
Government
Reporting structures, interactive form design, governance and deployment, tender workflow systems
Consultants
Data visualisation, Excel engineering, interactive form design, governance and deployment
Operations teams
Tender workflow systems, interactive form design, reporting structures, Excel engineering
Finance teams
Data visualisation, reporting structures, Excel engineering, governance and deployment
Compliance teams
Interactive form design, governance and deployment, reporting structures, tender workflow systems
Data & Reporting is used for:
You receive:
Excel dashboards
Reporting templates
Tender management systems
Interactive forms
Governance documentation
Related Services
Data Visualisation in Excel
Tender Management Solution
Form Design & Interactive PDFs
Excel Templates
Automated Template Deployment
Why DIGICoCo
Businesses choose DIGICoCo because
-
Business-grade reporting
-
Structured, clear design
-
Governance-ready systems
-
Microsoft 365 expertise
-
Fast turnaround
Your data will be clear, actionable, and built for decision-making
How It Works
1. Requirements
We understand your data, reporting needs, and business processes.
2. Design & structure
We design dashboards, reports, forms, and data structures.
3. Engineering
We build Excel models, automation, forms, and reporting systems.
4. Testing
We test with real data and refine for accuracy and usability.
5. Deployment
We deploy the solution and provide training and support.
Do you work with Excel, Power BI, or both?
Primarily Excel for this service, but we also support Power BI via Cocobites Solutions.
Can you visualise messy data?
Yes — we clean, structure, and visualise your data.
Need Clear, Actionable Data & Reporting?
Pricing
Based on:
- Number of tables
- Number of charts
- Complexity
- Turnaround time
See PowerPoint Presentation Pricing for general guidance.